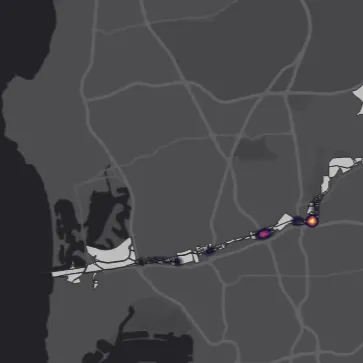
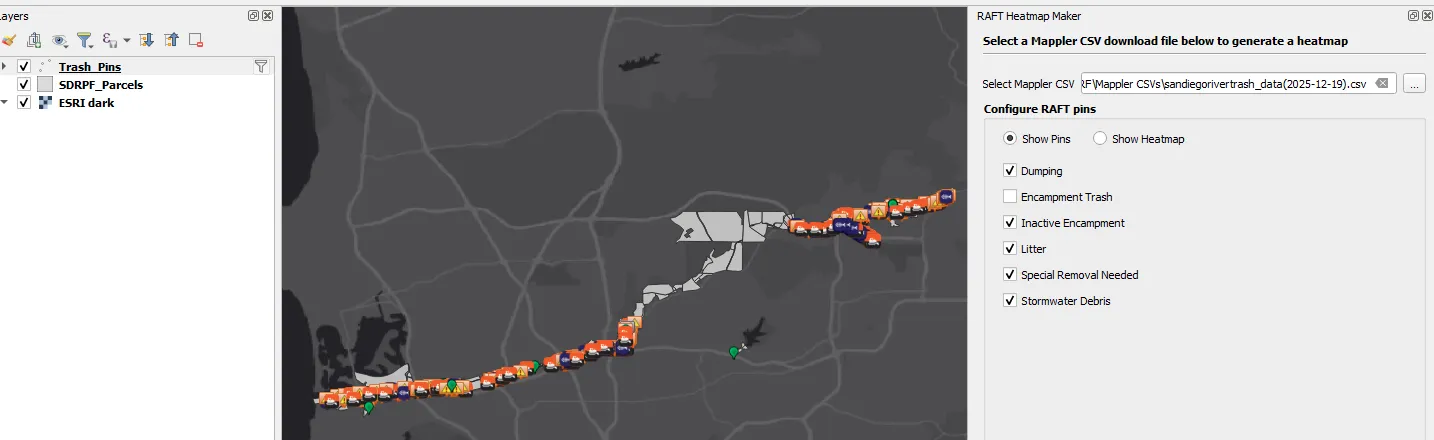
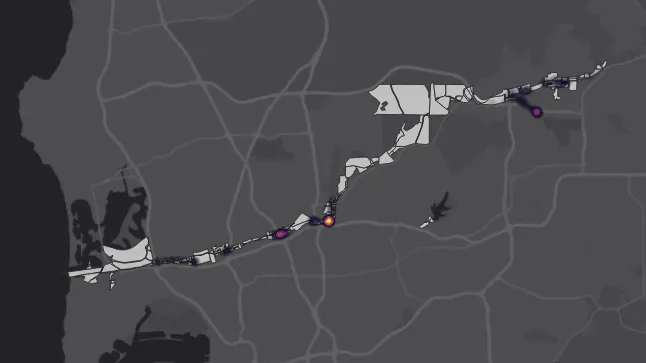
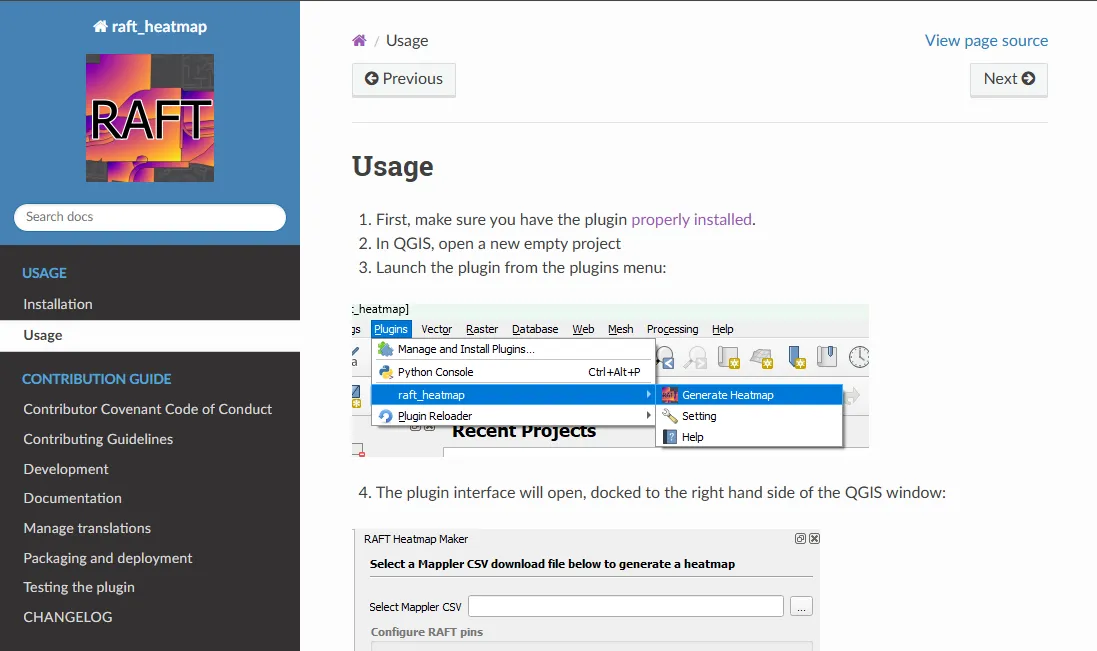
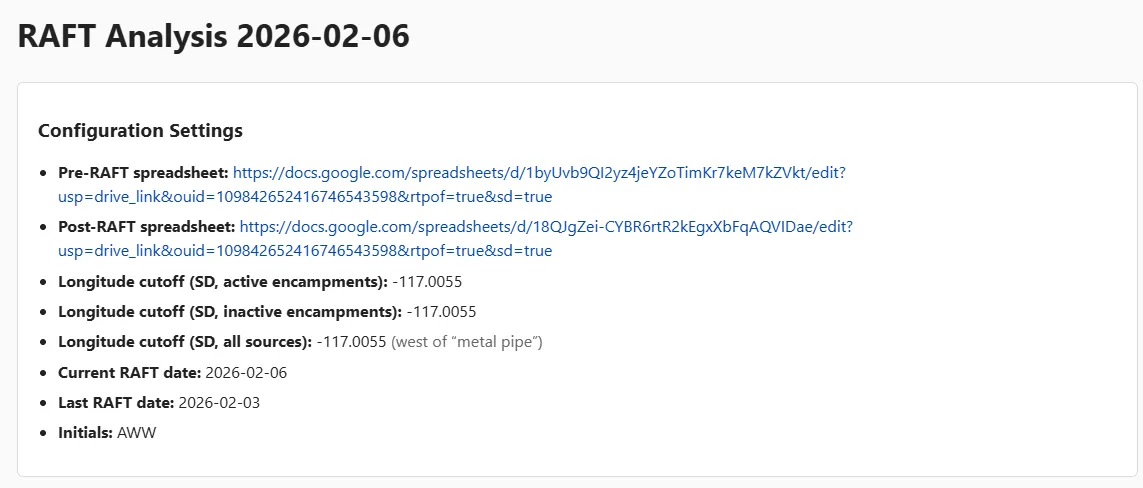
Overview: Plugin that streamlines custom heatmap generation for SDRPF River Assessment Field Team (RAFT) data. The plugin allows a user to select a CSV export from the RAFT program, filter data pins by category, and visualize pins as a heatmap. Ideal for generating maps of activity hotpots for presentations and as a starting point for further analysis. This project also serves as an example of QGIS plugin development for future RAFT interns.
Overview: The data analysis portion of my GIS Data and Field Internship involved several manual spreadsheet steps and a data join in QGIS. Once I got the hang of the manual process, I decided to automate the manual steps with Python. Although there is not impetus to integrate automation into this workflow at this time for this internship, I found it to be a useful exercise in applying my software skills to a common data problem.
Details:
Technology: Python, pandas, Google API Python Client, and the QGIS CLI
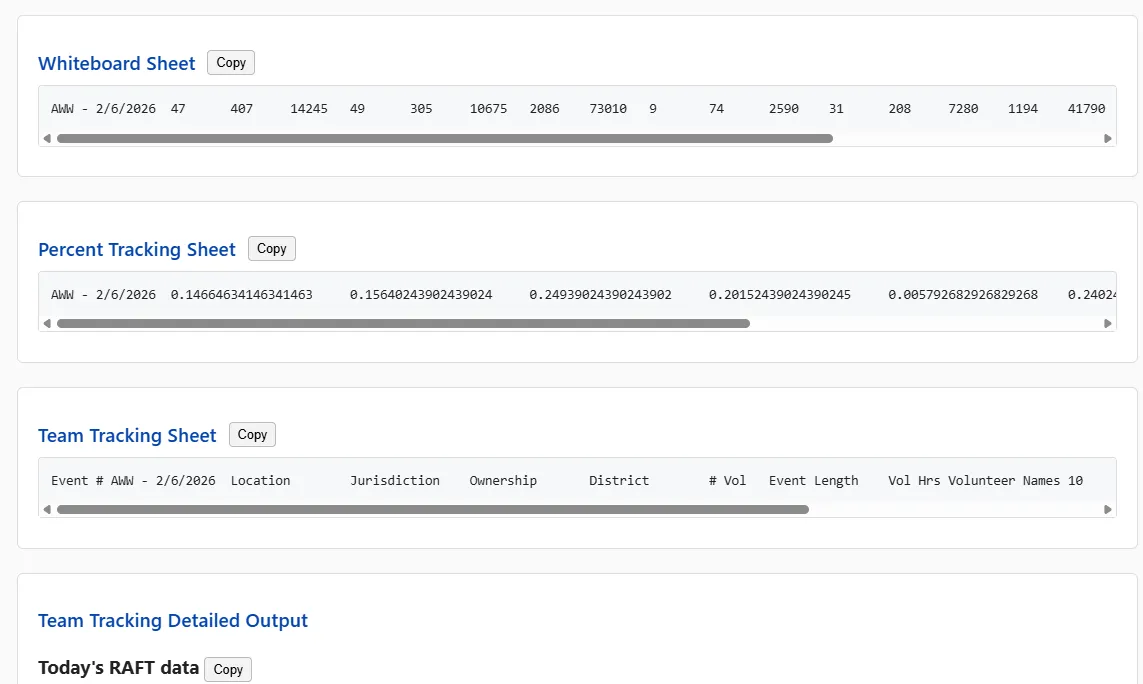
Generates an HTML page so that spreadsheet rows that can easily be copied and pasted into the manual process's output spreadsheet
Overview: In my previous career, I worked across industries, growing my skill set until I became a full-stack (server to fronted) senior software engineer with significant project oversight. I was ready for a career change, but I still very much enjoy coding and problem solving! Here I'll highlight a few projects I'm proud to have worked on over the years.
Details:
Technology: Too much to list! Enduring favorites: Python, Jupyter Notebooks, Typescript, HTML/CSS, SQL, React, and Git
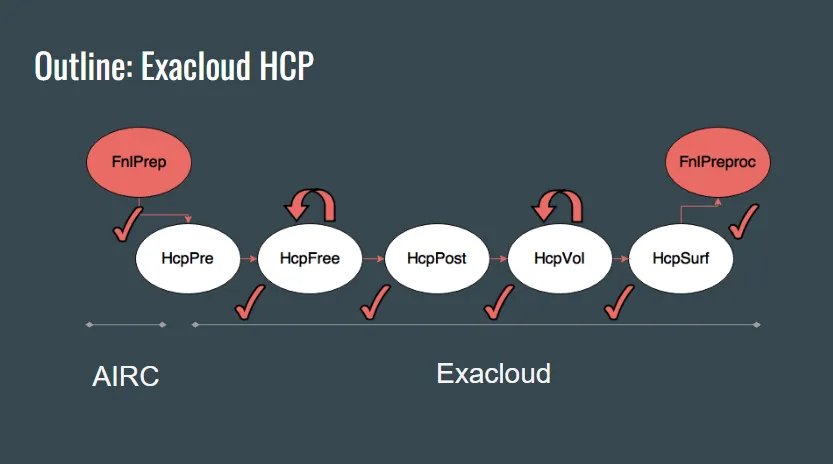
Fair Neuroimaging Lab: I built a Python pipeline wrapper to run the Human Connectome Pipeline for processing fMRI data on the OHSU HPC cluster. This pipeline was able to automatically resubmit jobs when they failed unexpectedly.
Memorial Sloan Kettering Cancer Center: I developed a visualization tool in D3.js that was used by nurses in a pilot study for proactive care for chemo patients who reported worsening symptoms in daily web-based surveys. This pilot showed a significant reduction in ER visits by chemo patients following treatment!
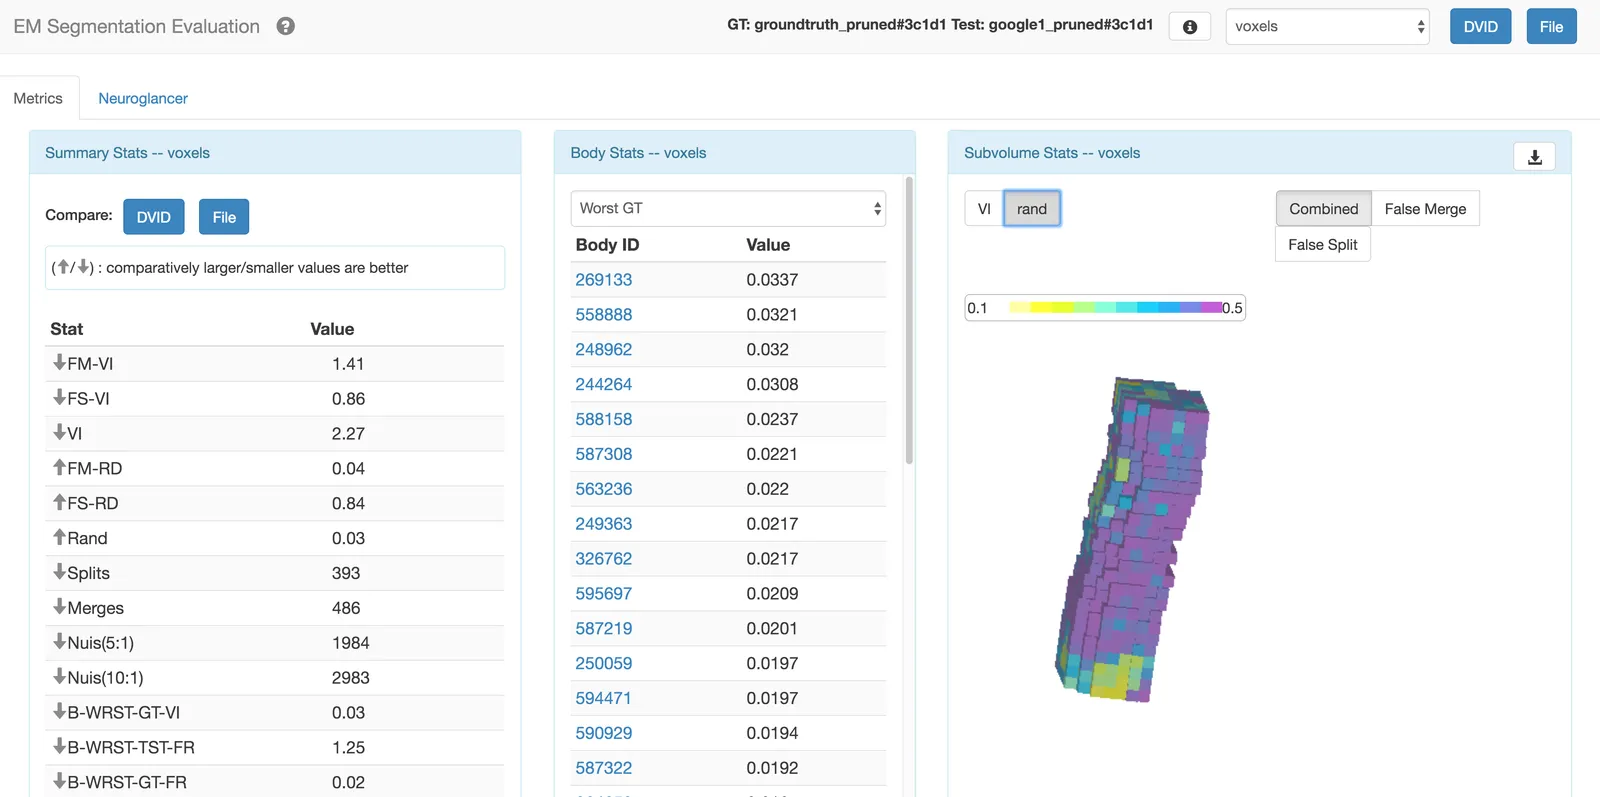
Janelia Research Institute: I maintained a visualization tool that was used to evaluate data quality of automated neuroimaging data segmentation using Three.js
Primary Kids: as part of a small team, overhauled an entire e-commerce site to reach full accessability compliance for visually-impaired users